Calculate Your Shopify Visible Discount Revenue Lift
Run the numbers on your store. See exactly what Shopify visible discount revenue looks like at $10K, $50K, and $100K monthly tiers.
Calculate Your Shopify Visible Discount Revenue Lift
Let’s get specific about what Shopify visible discount revenue is worth to your bottom line.
This is not theoretical. This is math. Your numbers, your store, and what a real conversion improvement translates to in monthly revenue.
The Revenue Calculation Framework
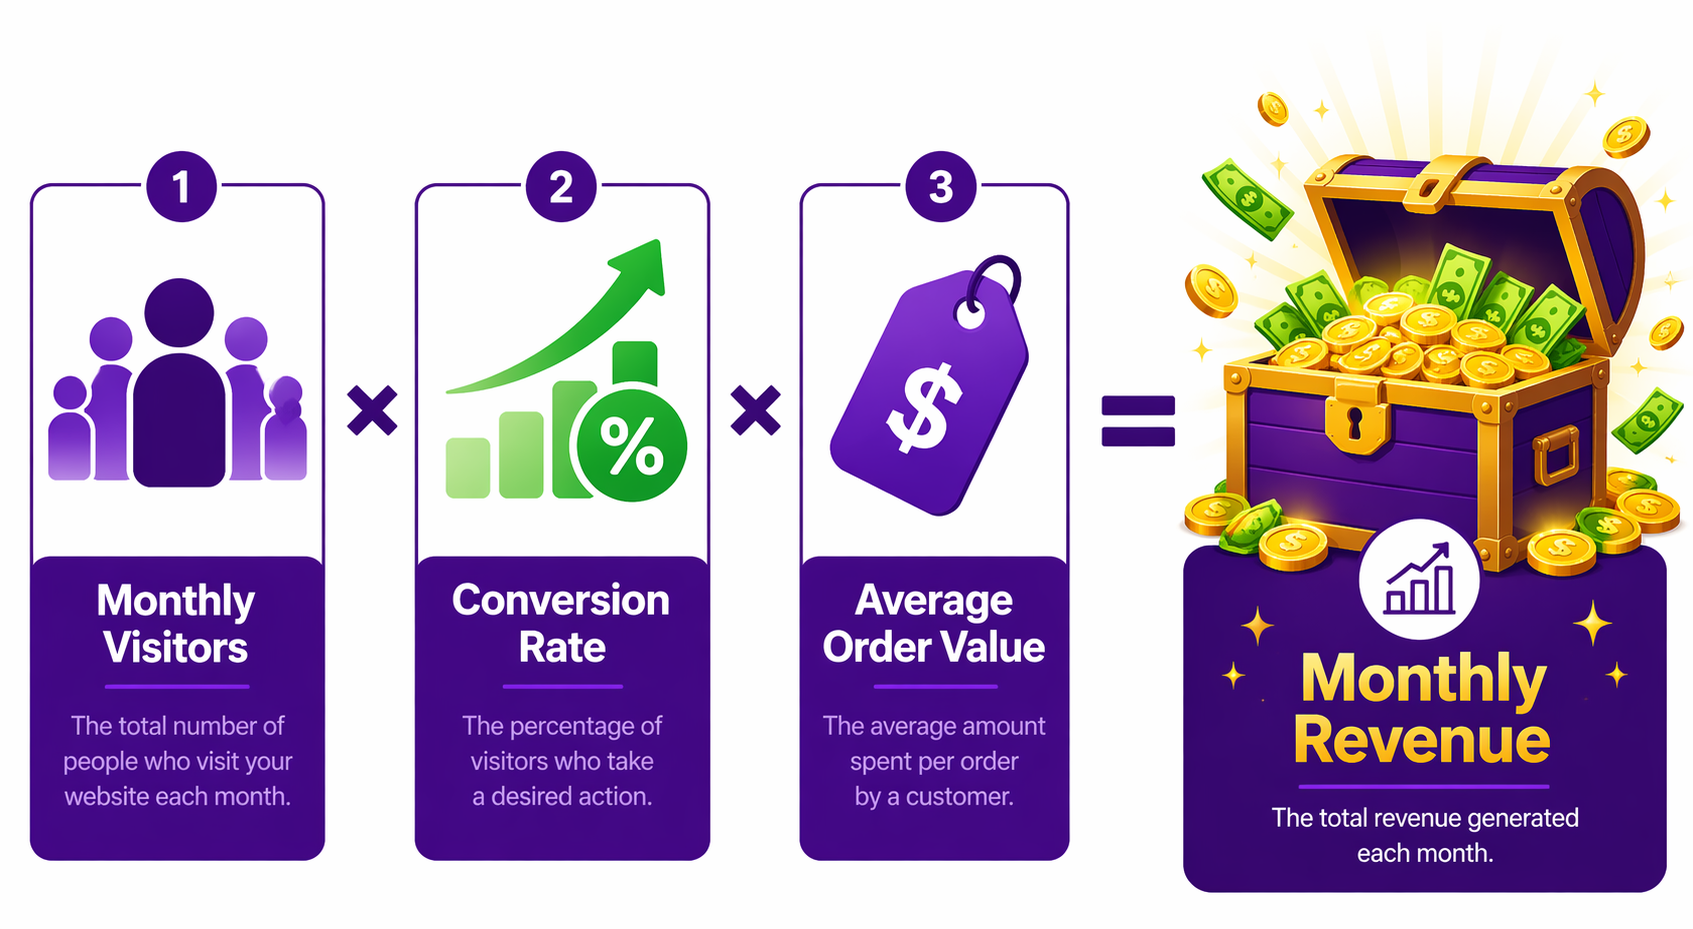
Shopify visible discount revenue starts with one formula. Monthly revenue is a function of three variables:
Monthly Visitors × Conversion Rate × Average Order Value = Monthly Revenue
Let’s use that framework.
Baseline Store:
- Monthly visitors: 10,000
- Conversion rate: 2.5%
- Average order value: $75
- Monthly revenue: $18,750
Now, what happens if you increase conversion rate by 20% (the average for Adsgun merchants)?
After Visible Discounts:
- Monthly visitors: 10,000 (same)
- Conversion rate: 3.0% (up from 2.5%)
- Average order value: $75 (same)
- Monthly revenue: $22,500
Revenue improvement: +$3,750 monthly, or $45,000 annually.
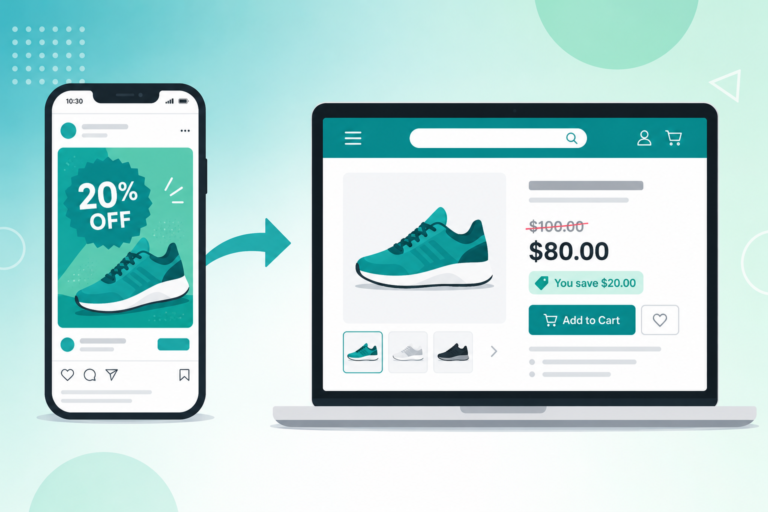
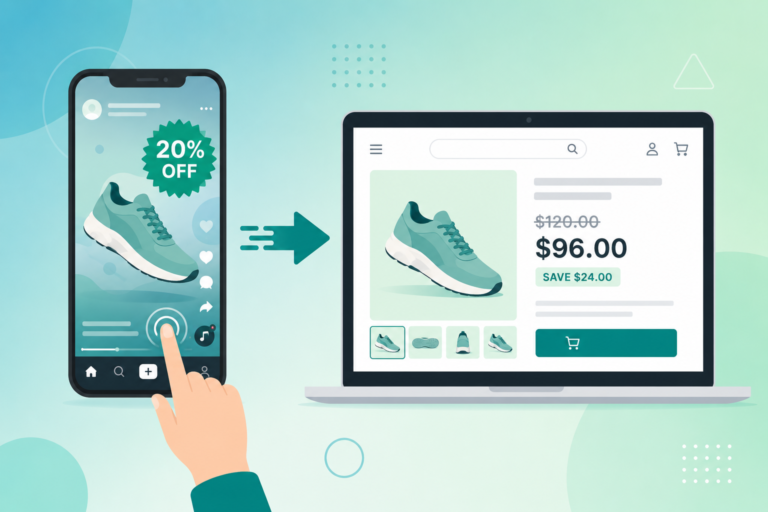
Nothing changed except the visibility of the discount. No additional traffic, no higher pricing, no operational changes. Just showing the deal earlier in the customer journey.
What a 10% Conversion Improvement Means by Store Size
Not all stores are the same size. Let’s break this down by revenue level.
Small Store ($10K Monthly Revenue)
Baseline: 5,000 visitors at 2% conversion and $100 AOV gives you $10,000 in monthly revenue. With a 10% conversion improvement, those same 5,000 visitors convert at 2.2% and the AOV stays at $100, which produces $11,000 per month.
Monthly gain: $1,000 ($12,000 annually)
For a small store, a 10% conversion improvement is meaningful. That is a part-time employee’s salary, that is inventory budget, and growth capital.
Mid-Size Store: Shopify Visible Discount Revenue at $50K
Baseline: 15,000 visitors at 2.22% conversion and $150 AOV gives you $50,000 in monthly revenue. With a 10% conversion improvement, the conversion rate moves to 2.44% and revenue climbs to $55,000 per month.
Monthly gain: $5,000 ($60,000 annually)
For a mid-size store, an extra $5,000 per month is significant. That is hiring money. Inventory expansion. Marketing budget.
Large Store ($100K Monthly Revenue)
Baseline: 25,000 visitors at 2.67% conversion and $150 AOV gives you $100,000 in monthly revenue. With a 10% conversion improvement, the conversion rate moves to 2.93% and revenue climbs to $110,000 per month.
Monthly gain: $10,000 ($120,000 annually)
For a large store, an extra $10,000 per month is game-changing. That scales hiring, inventory, and expansion.
Why 10% Is Conservative for Shopify Visible Discount Revenue
The calculations above use a 10% conversion improvement to stay safely below industry Shopify conversion benchmarks, where the median sits around 2.81%. Adsgun’s actual data shows 20% average improvement across 400+ merchants.
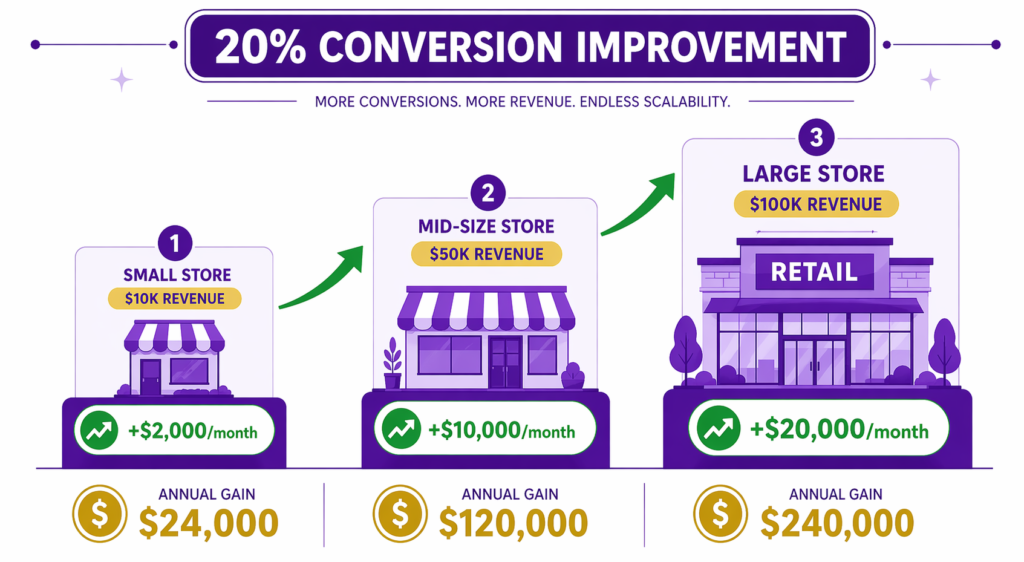
Let’s recalculate with 20%.
- Small Store ($10K): Monthly gain $2,000 ($24,000 annually)
- Mid-Size Store ($50K): Monthly gain $10,000 ($120,000 annually)
- Large Store ($100K): Monthly gain $20,000 ($240,000 annually)
Tire Streets achieved a 14% improvement, sitting between the conservative and average estimates. Even that single result generated $37,800 in additional revenue during BFCM.
The opportunity is significant at every store size.
The Hidden Cost of Not Showing Discounts
Here is another way to think about Shopify visible discount revenue: every visitor who abandons without seeing the discount is paid acquisition cost with zero return.
Let’s say your store spends $3 per visitor in ads, a reasonable estimate depending on channel. With a 2.5% conversion rate and the discount hidden until checkout, you pay $3 to acquire 100 visitors and 2.5 of them convert. Your customer acquisition cost cost lands at $120.
With a 3% conversion rate and the discount visible from the product page, you pay $3 to acquire 100 visitors and 3 of them convert. Your customer acquisition cost drops to $100.
Lower CAC. Same ad spend. Better unit economics.
When you scale this across thousands of visitors, the difference becomes substantial. A store with 25,000 monthly visitors is essentially wasting around $3,750 per month in ad spend on visitors it is not converting at optimal rates. Some of that loss comes from cart abandonment driven by visibility issues, some from earlier-stage drop-off. Either way, fixing the leakage is the quickest path to profitability.
The ROI of Adsgun: Pricing vs Shopify Visible Discount Revenue
Adsgun’s pricing structure is designed to scale with the value it generates.
- Free plan: core features, limited to one promotion, no advanced features
- Core plan: $19 per month plus 1.5% of additional revenue from discounted orders
- Plus plan: $99 per month plus 0.7% of additional revenue from discounted orders
Let’s calculate ROI for the Core plan, the most common.
Mid-Size Store ($50K Monthly Revenue)
You install Adsgun on the Core plan. Conversion rate improves from 2.22% to 2.67% (a 20% improvement). Monthly revenue increases from $50K to $60K. Adsgun cost is $19 + (1.5% × $10K additional revenue), which equals $169 per month.
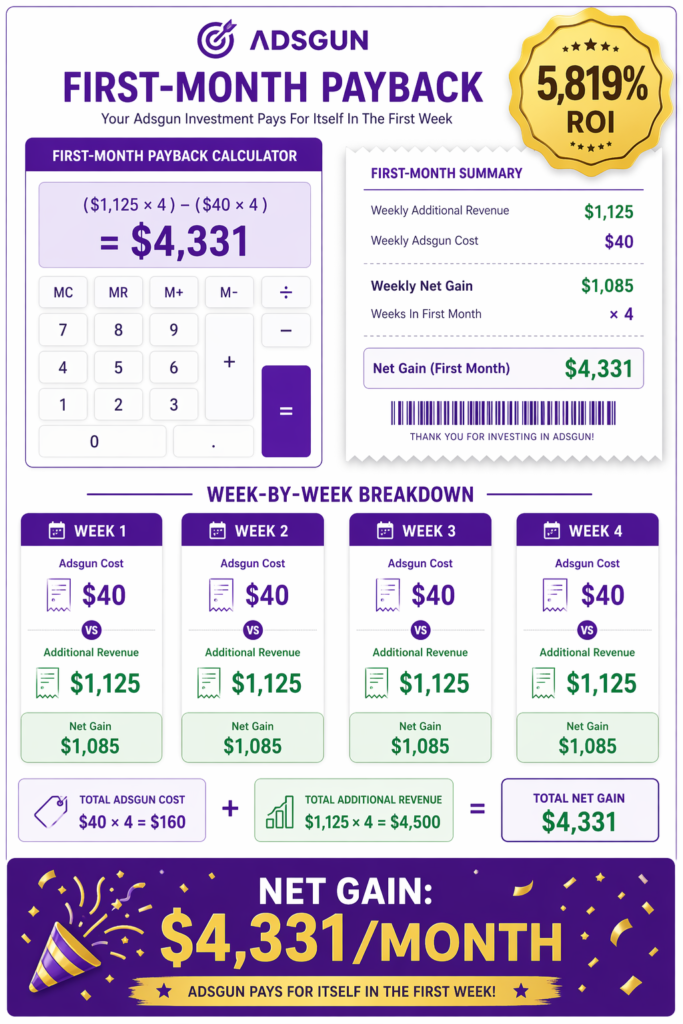
Net gain: $9,831 per month. ROI: 5,819%.
Even accounting for Adsgun’s cost, the return is extraordinary.
When Does Adsgun Break Even?
Adsgun’s pricing is designed so that even very small improvements create break-even quickly.
At minimum, a store needs a 10% conversion improvement on $50K monthly revenue. That creates $5K additional revenue, which covers the $169 Adsgun cost almost 30 times over. Even a store with just a 2% to 3% improvement breaks even.
In reality, most stores see 10% to 20% improvement, which means break-even happens in the first week and positive ROI compounds from there. For more tactics that compound on top of visible pricing, see our guide on how to push sales on Shopify.
First Month Payback Calculation
Let’s run a real scenario.
Your store today:
- $50K monthly revenue
- Running a 20% off promotion this month
- Want to increase conversion
You install Adsgun on day 1 of the promotion. Set up follows the standard flow for showing discounted prices on Shopify product pages.
Week 1: You normally convert 100 orders. With visible pricing, you convert 115 orders, a 15% improvement. Additional revenue is $1,125 (15 orders × $75 AOV). Adsgun cost is roughly $40 pro-rata weekly. Net gain: $1,085.
Weeks 2 to 4 (same pattern): Additional revenue per week is around $1,125. Adsgun cost per week is around $40. Net gain per week: roughly $1,085.
Month total: Additional revenue around $4,500. Adsgun cost around $169. Net gain: $4,331.
You have paid for a year of Adsgun and then some.
This is why merchants pick Adsgun. The ROI is immediate and obvious.
The Bottom Line: Revenue Math Is Simple
More conversions, more revenue.
Show discounts earlier, then more conversions, then more revenue. The math does not lie. A 10% to 20% conversion improvement on your existing traffic is worth thousands of dollars monthly to your store, and that is exactly what Shopify visible discount revenue looks like in practice.
If you want to expand the same logic into average order value gains too, strike-through pricing on collection pages and auto-applied promotion codes compound the effect.
Run the Math on Your Own Store
What is a 10% conversion improvement worth to you?
Adsgun delivers that improvement, and typically more, by showing discounts on product pages. Try it free for 7 days and calculate your exact payback.
Start Your Free 7-Day Trial and see real Shopify visible discount revenue improvement on your own numbers.