Shopify Cart Abandonment Statistics 2026: What the Data Means
Shopify cart abandonment statistics 2026 with Baymard data, the seven reasons shoppers leave, and a three-tool recovery stack that wins back 15 to 30 percent of abandoned carts.
If you run a Shopify store, roughly seven out of every ten people who add something to their cart leave without buying. This guide unpacks the Shopify cart abandonment statistics 2026 that matter, why those carts get abandoned in the first place, and the three-tool recovery stack that consistently wins 15 to 30 percent of lost carts back. By the end, you have benchmarks for your category, a diagnostic for your funnel, and a concrete recovery plan.
The Headline Shopify Cart Abandonment Statistic 2026: 70% of Carts Are Abandoned
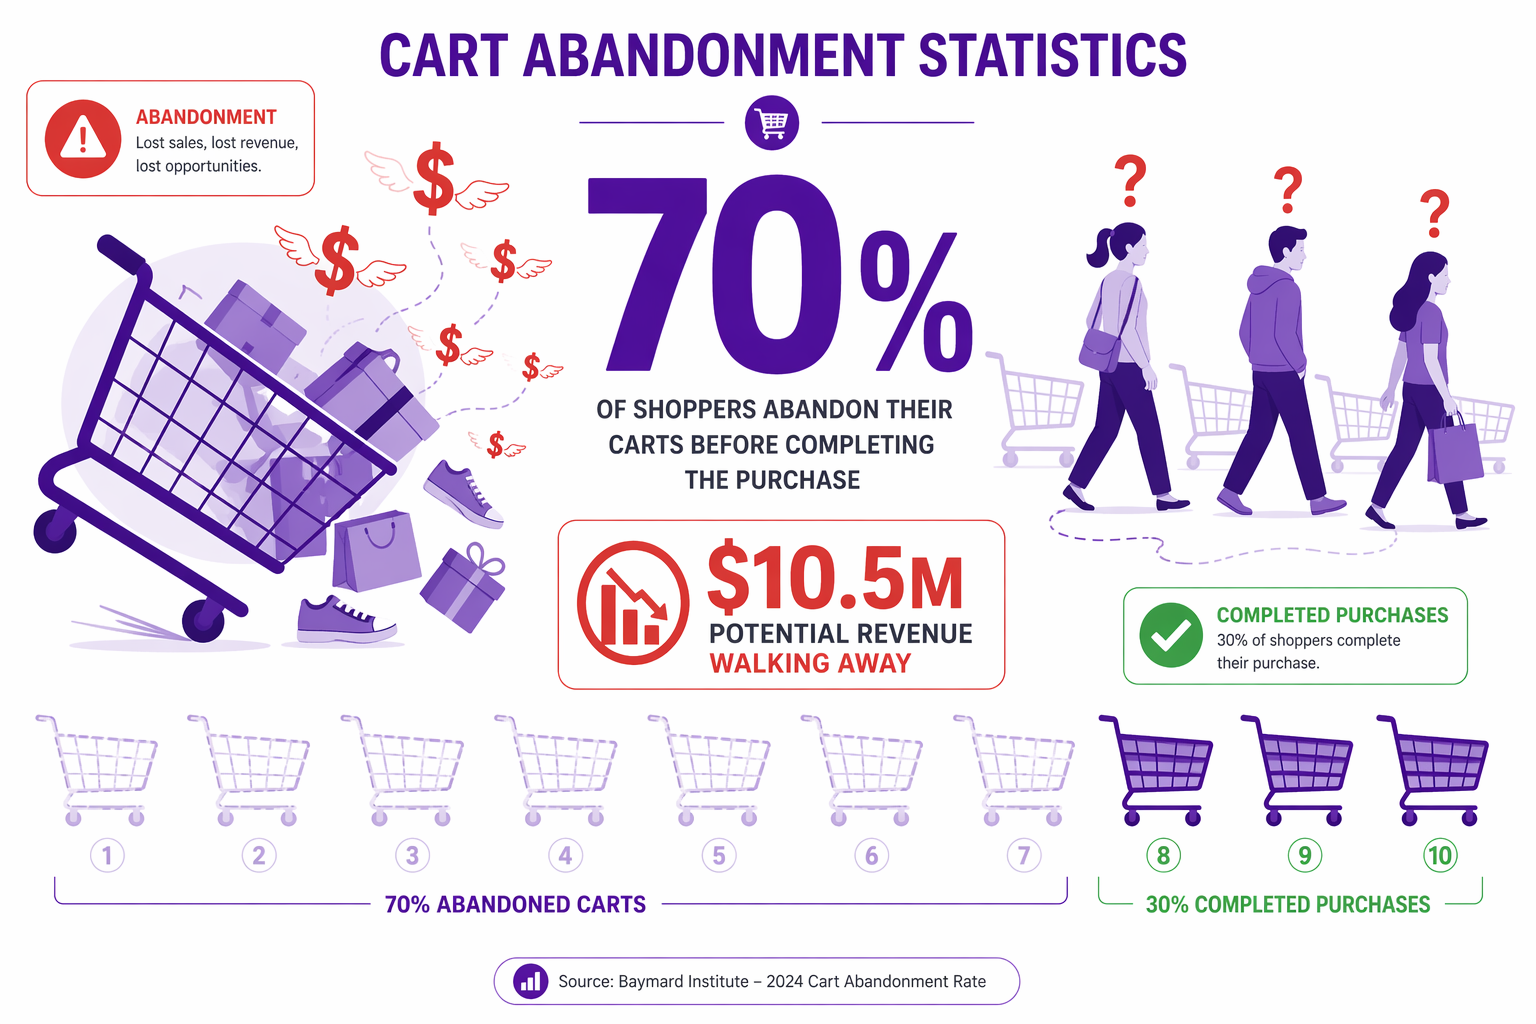
For every 100 people who add items to their cart on a typical Shopify store, 70 leave without completing the purchase. This is the industry baseline confirmed by Baymard Institute’s aggregate of 49 separate studies, which puts the global cart abandonment average at 70.19%. Some categories are worse (high-fashion can exceed 80%); some are better (subscription and SaaS can dip to 60%).
What does this mean in dollars?
If your store does $100K/month in revenue with a 3% conversion rate (100K divided by 3% equals 3.33M sessions), you have about 100K add-to-carts. 70K of those abandon.
At your average order value ($150), those 70K abandoned carts represent $10.5M in potential revenue walking away.
Recovering just 5% of those abandoned carts (3,500 carts) adds $525K/month in revenue.
This is why cart abandonment is one of the most important metrics in ecommerce, and why the Shopify cart abandonment statistics 2026 deserve a closer look than a single headline number.
Why People Abandon Carts: The 2026 Data
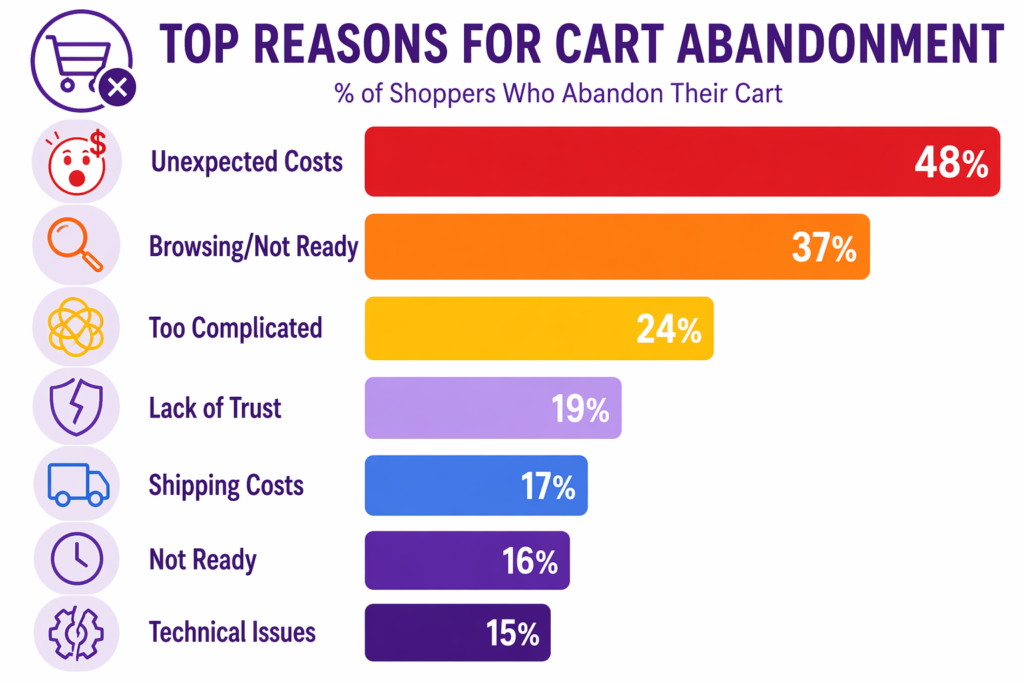
Baymard Institute, which surveys thousands of online shoppers, has mapped the primary reasons for cart abandonment. The categories below overlap (most shoppers cite multiple reasons), but the ranked breakdown holds across studies:
- Unexpected Costs (48%): Customers see products at one price, proceed to checkout, and see a different total once shipping, taxes, and fees are added. If the surprise is large, they abandon. This is the number one reason.
- Browsing / Not Ready (37%): The customer is not ready to buy yet. They are browsing multiple products, comparing options. They may return later. Not urgent to them today.
- Too Complicated (24%): The checkout process is confusing. Too many fields, unclear questions, slow page load, or a confusing form layout drive abandonment.
- Lack of Trust (19%): Customer does not trust the store. No reviews, no brand recognition, a sketchy-looking site, or an unclear return policy.
- Shipping Costs (17%): Shipping charge is too high. Some customers specifically abandon if shipping is over 25% of order value.
- Not Ready (16%): Overlaps with browsing, but the customer explicitly was not ready. They did not have their wallet, wanted to check with someone, or wanted to sleep on it.
- Technical Issues (15%): Site crashed, checkout failed, payment processor rejected the card.
Percentages add up to more than 100% because many customers cite multiple reasons.
The Adsgun Angle: Unexpected Cost Shock
Here is the mechanism. When discounts are hidden until checkout, customers experience what behavioral researchers call “unexpected cost shock,” and the same effect explains why the number one reason for abandonment is cost surprise.
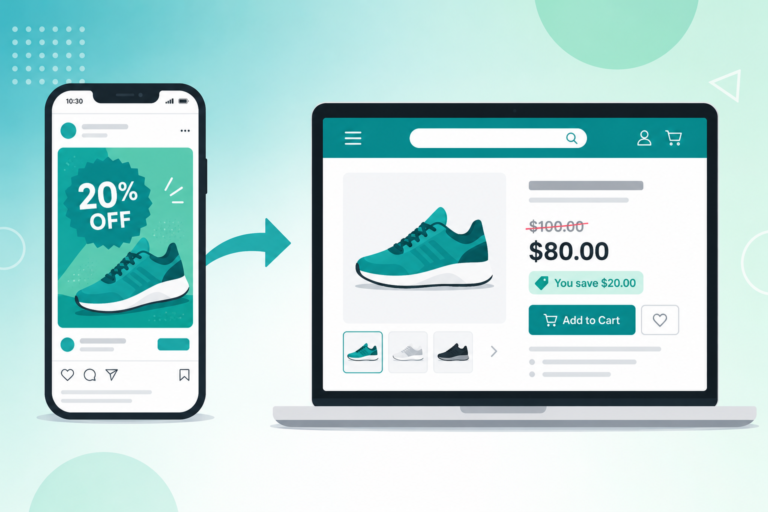
A customer browses your store, sees a $99 sweater, adds it to cart. Their cart now shows $99. They proceed to checkout. At checkout, they see a $20 discount applied (an automatic discount for orders over $75, for example).
The customer’s perception: “I thought I was paying $99, but now it is $79. The true price is lower than I thought.”
While this seems positive (surprise savings), it actually creates friction because the customer’s mental model of the price was wrong. They made the decision to buy at $99. The discount feels like a change in the rules at the worst possible moment.
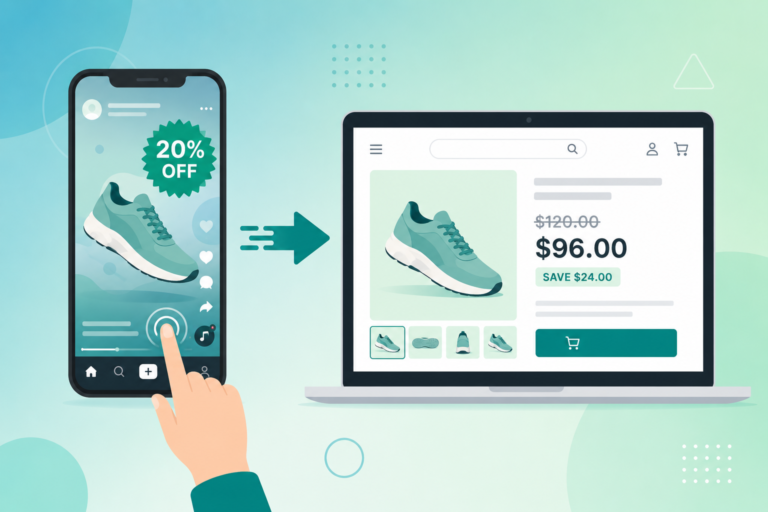
Contrast this with the visible-pricing alternative: customer sees a $99 product with strike-through pricing showing “Was $99, Now $79” on the product page itself. They make the decision to buy at $79. When they reach checkout and see the same $79, there is no surprise. The price has been consistent throughout the journey.
Research shows that consistent pricing throughout the customer journey reduces “unexpected cost” abandonment by roughly 20%. This is one of the highest-impact friction reductions you can make to a Shopify checkout, and it is precisely what makes visible discount displays the first tactic in any serious Shopify CRO playbook.
Shopify-Specific Cart Abandonment Statistics 2026
Shopify-published data and aggregated industry benchmarks show the abandonment rate varies significantly by device, traffic source, and category.
Abandonment by Device
- Mobile abandonment: 73%
- Desktop abandonment: 68%
Mobile customers are slightly less committed and more easily distracted. Smaller screens, slower 4G connections, and one-handed scrolling all add friction. Make sure your mobile checkout is genuinely optimized, not just responsive.
Abandonment by Traffic Source
- Organic abandonment: 68%
- Paid (Google Ads, Facebook) abandonment: 72%
- Email abandonment: 60%
- Direct abandonment: 65%
Paid traffic has higher abandonment because it is colder. Those customers are just meeting your brand via the ad. Email has the lowest abandonment because it is warmer (existing relationship), which is why a strong Shopify email discount strategy is the single most reliable revenue lever you can pull.
Abandonment by Product Category
- Luxury goods: 75-80%
- Apparel: 70-75%
- Electronics: 65-70%
- Food and Beverage: 55-65%
- Subscriptions: 40-50%
Higher-priced categories have higher abandonment. Bigger decision, more deliberation, more comparison shopping.
The Real Cost of Abandonment
If your store’s theoretical revenue (every add-to-cart converts) is $1M/month, your actual revenue is roughly $300K/month.
A 5% improvement in abandonment recovery (70% to 65%) means recovering 5% of abandoned carts. On $1M theoretical volume, that is $50K/month in additional revenue.
Even a 2% improvement adds $20K/month. Pair that with disciplined Shopify discount profit margin tracking and you can confirm the recovered revenue is actually flowing to the bottom line, not getting eaten by deeper recovery discounts.
The Cart Recovery Stack: Three Tools Working Together
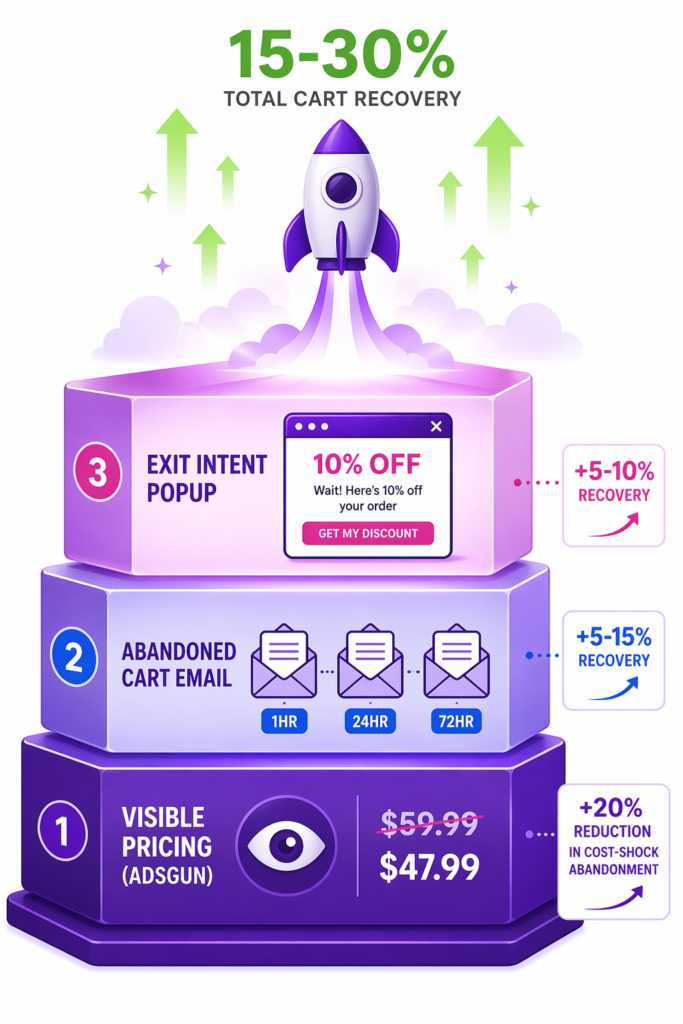
No single tool fixes cart abandonment alone. The merchants who recover 15 to 30% of abandoned carts run a layered stack where each tool catches a different segment of abandoners.
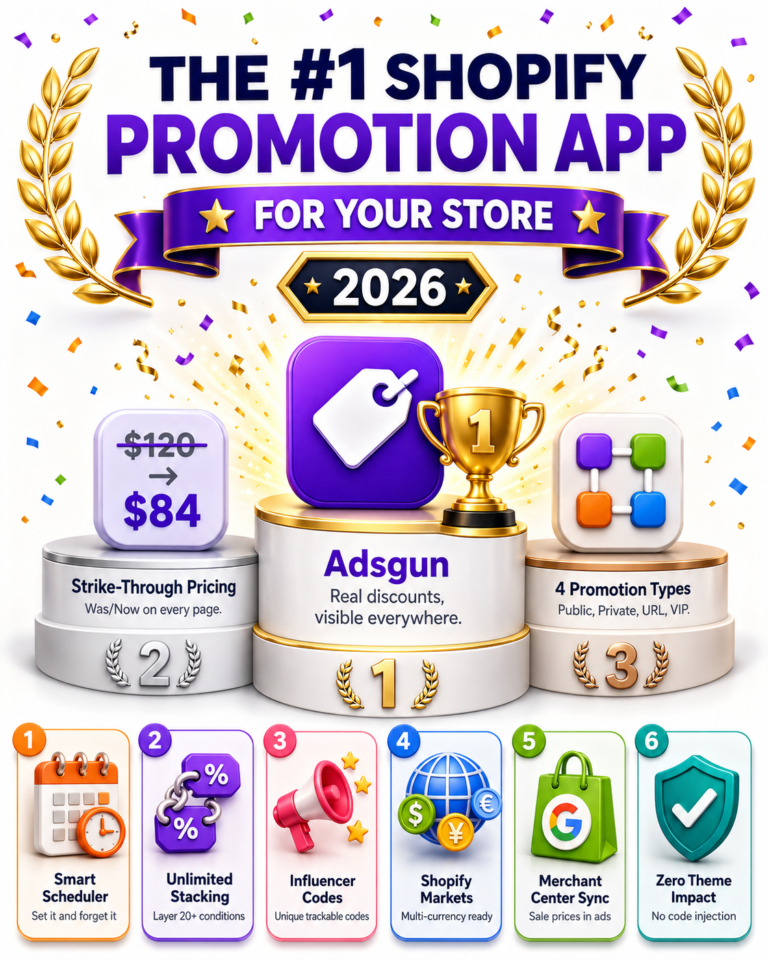
Tool 1: Visible Pricing (Adsgun)
Addresses the “unexpected costs” reason. By showing discounts before checkout, you set correct price expectations. This alone reduces unexpected-cost abandonment by roughly 20%, which translates to about 9.6 percentage points off your total abandonment rate (20% × 48% = 9.6 pp).
Tool 2: Abandoned Cart Email Sequence
Use a platform like Klaviyo or Postscript and send a three-step sequence:
- 1-hour email: “You left something behind. Here is your cart link.”
- 24-hour email: “Last chance. We are holding your cart. [Link]”
- 72-hour email: “Final reminder. Your cart expires tomorrow. [10% off if you complete today]”
Email recovery converts 5-15% of abandoners (depending on audience and email quality). On 70K abandons, that is 3,500 to 10,500 recovered carts per month.
Tool 3: Exit Intent Popup With a Discount
When a customer is leaving without buying, show a popup offering 10% off if they complete the purchase now. This captures some abandoners in real-time, before they ever need the email sequence.
Exit popups convert 5-10% of viewers, which translates to 5-10% of total abandoners.
Combined impact: Visible pricing plus abandoned cart email plus exit popup can recover 15-30% of abandoned carts, which pulls overall abandonment from 70% down toward 50-60%. The math on this kind of recovery is exactly the same lever Tire Streets pulled to capture an additional $37,800 in BFCM revenue with the same traffic.
Data Point: The 5% Recovery Math
- Add-to-carts per month: 100,000
- Current abandonment: 70% = 70,000 abandoned
- Recovery goal: 5% of abandoned carts = 3,500 carts recovered
- Average order value: $150
- Revenue recovered: 3,500 × $150 = $525,000
Even at 2% recovery (700 carts), that is $105,000/month in additional revenue. This is why cart recovery is a priority lever for scaling Shopify stores, and one of the highest-ROI projects in any quarterly roadmap.
Cart Abandonment FAQ
How quickly should I send the first abandoned cart email?
1-2 hours is optimal. Fast enough that the customer remembers their cart, slow enough that they have actually left your site rather than briefly switched tabs.
Should I offer a discount to recover abandoned carts?
Yes. 10-15% off in the first email and 15-20% off in the final email is industry standard. It costs you margin but recovers revenue you were going to lose anyway. For more on discount depth versus margin, see our Shopify discount profit margin guide.
How long should I wait before marking a cart as abandoned?
10-30 minutes is the modern standard. Shopify’s default is 24 hours, but most dedicated recovery tools fire on faster triggers because the conversion window decays sharply after the first hour.
Can I recover carts from anonymous (non-logged-in) customers?
Only if they provided an email address at the start of checkout. Shopify’s native abandonment tracking captures this when the email field is filled, even if the customer never completes the purchase.
What is the expected ROI on a cart recovery campaign?
3 to 5x typically. If you spend $1 recovering abandoned carts, you recover $3-5 in revenue. The exact return depends on AOV, recovery discount depth, and how warm your audience is.
Does visible pricing (Adsgun) reduce abandonment?
Yes. Research shows consistent pricing (what they see on the product page equals what they see at checkout) reduces unexpected-cost abandonment by approximately 20%. This is also why hiding discounts behind compare at price tends to backfire: customers see one number on the product page and a different one at checkout.
The 2026 Cart Abandonment Landscape
Mobile abandonment is still the biggest single challenge in 2026. Video-based checkout and one-click checkout options (Apple Pay, Google Pay, Shop Pay) are becoming standard and meaningfully reducing friction on mobile, especially for repeat customers.
AI-powered exit offers (personalizing the discount offer based on customer behavior, cart value, and visit history) are becoming more common and pushing recovery rates beyond what static “10% off” popups can deliver.
But the fundamentals have not changed. Set correct price expectations early. Make checkout fast and clear. Recover abandoners via email. Stores that master all three will abandon (no pun intended) the competition.