How to Measure Shopify Promotion Lift the Right Way
Sale week revenue minus last week is not lift. Learn the proper holdout test, sample sizes, cannibalization, and a worked example.
You ran a 20% off sale last week and revenue jumped 35%. Promotion success, right? Probably not. The merchant down the street who ran the same sale the week before got the same number, and so did the merchant who did nothing at all. The question you actually want answered is whether the promotion caused the lift, or whether the calendar, paid traffic, an Instagram post, or sheer luck did. To measure Shopify promotion lift accurately you have to compare what happened to what would have happened without the promo, and that is a very different exercise from staring at last week’s revenue dashboard.
This guide walks through the proper way to do it: holdout tests, sample sizes that actually deliver a result, cannibalization, attribution windows, and a worked example with real numbers. By the end you will know whether your next promotion is genuinely profitable or just an expensive shuffle of sales you would have made anyway.
Why “sale week vs last week” is not how to measure Shopify promotion lift
The most common merchant approach to measure Shopify promotion lift is to look at revenue during the sale and compare it to a recent non-sale week. If sale week earned $48,000 and the prior week earned $34,000, the temptation is to call it $14,000 of promotion-driven revenue. That is wrong almost every time.
Three things change between any two weeks on a Shopify store, and they all distort the comparison.
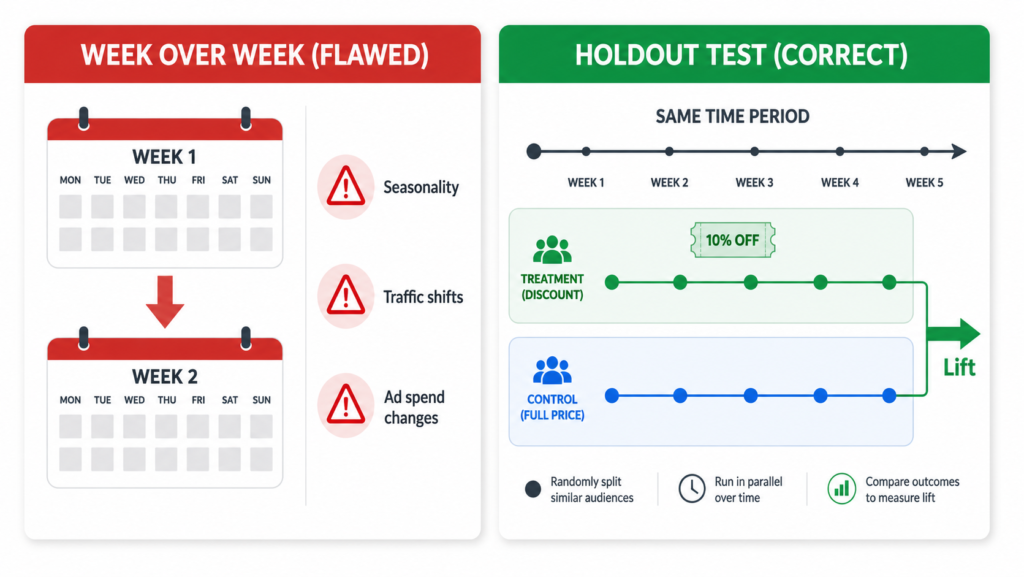
- Seasonality. Traffic and conversion curves are not flat. A normal Tuesday in March is not the same as a normal Tuesday in November. Buyer intent shifts by season, by month, by day of the week. Comparing a sale week to a non-sale week pretends those curves are flat. They are not.
- Traffic and spend shifts. Paid budgets, email send volume, organic ranking, influencer mentions, and PR all move week to week. If you increased ad spend by 20% for the sale, part of the revenue lift came from the ad spend, not the discount. If a creator posted about you mid-sale, that is not the discount either.
- Self-selection. People who buy during a sale are a different audience than people who buy in a non-sale week. Discount-hunters arrive when the price drops. The mix of shoppers is not stable, so the comparison is not apples to apples.
Stack the three together and a week-over-week comparison is a story, not a measurement.
The right way: a holdout test
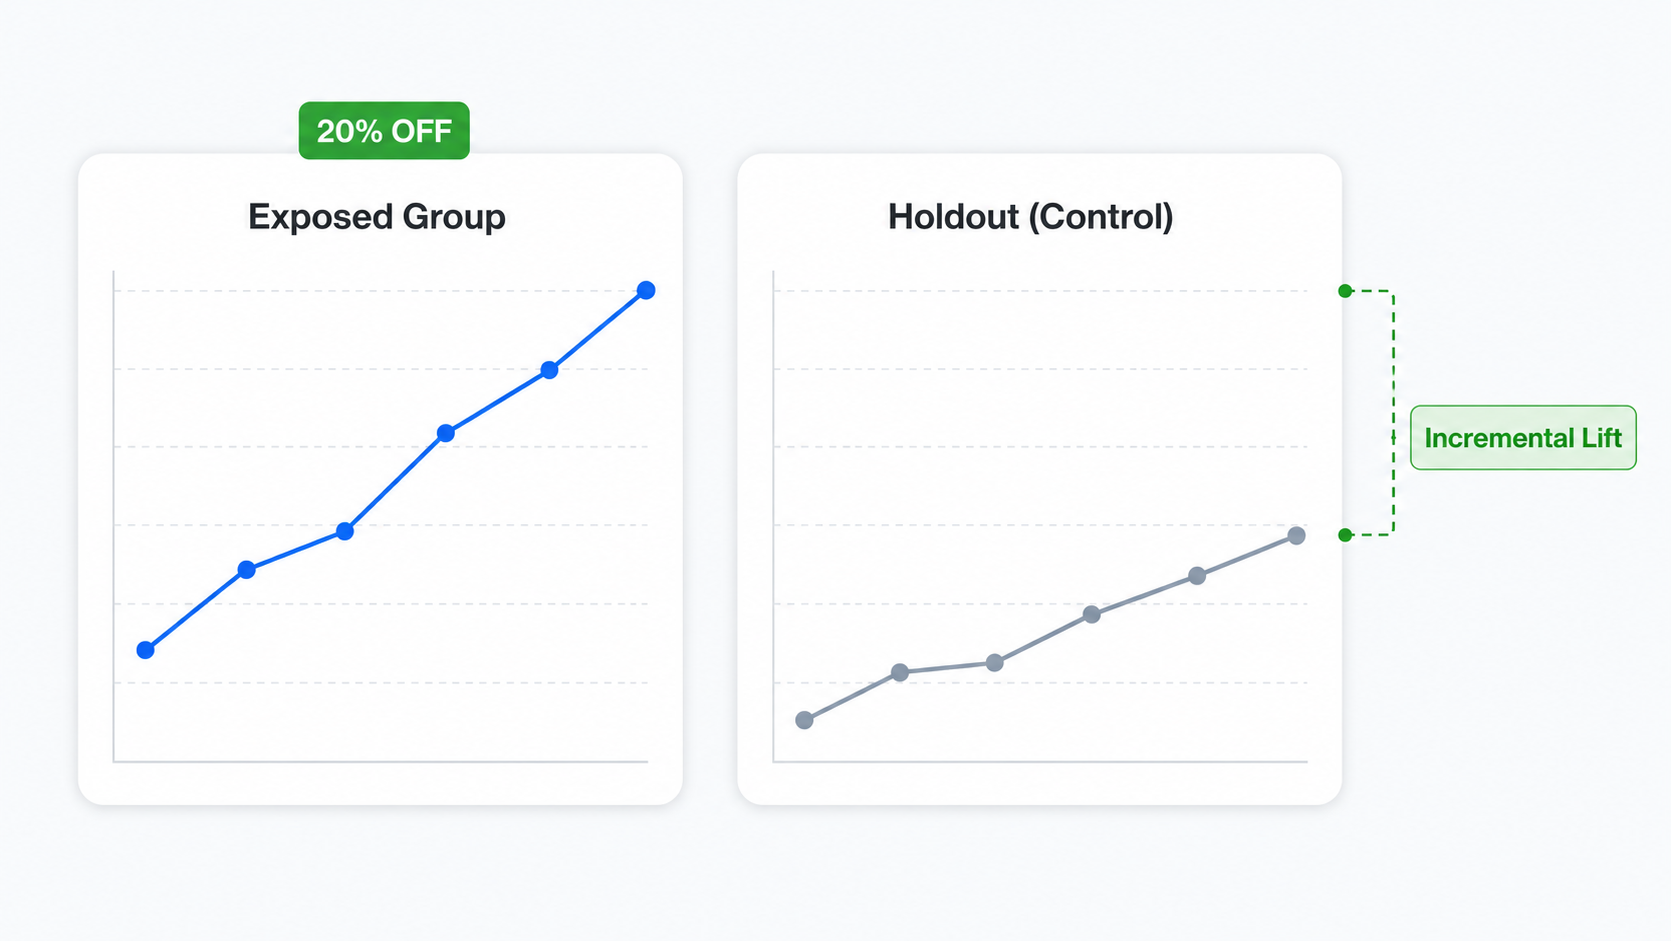
A holdout test is the cleanest way to measure Shopify promotion lift, and it is the same logic behind the incrementality testing Meta and Google run — the difference being that they randomize ad exposure at the user level, while a holdout like this randomizes on-site promotion exposure. You randomly split your traffic during the same time window. One group sees the promotion. The other (the holdout, or control) sees the store at full price. Because the only systematic difference between the two groups is exposure to the promotion, the gap in their revenue per visitor is the incremental lift.
This is sometimes called incrementality testing. The framing in academic and industry research is consistent: lift is the difference in outcomes between an exposed group and an unexposed holdout group, where everything else is held constant. Attribution distributes credit across touchpoints. Incrementality measures cause.
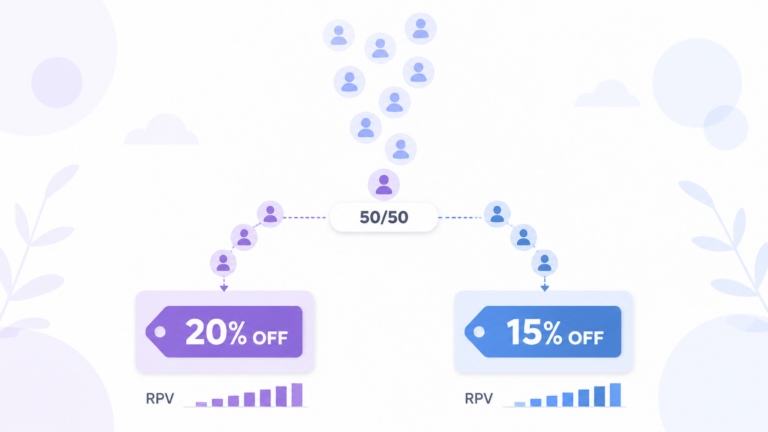
The conceptual setup is simple.
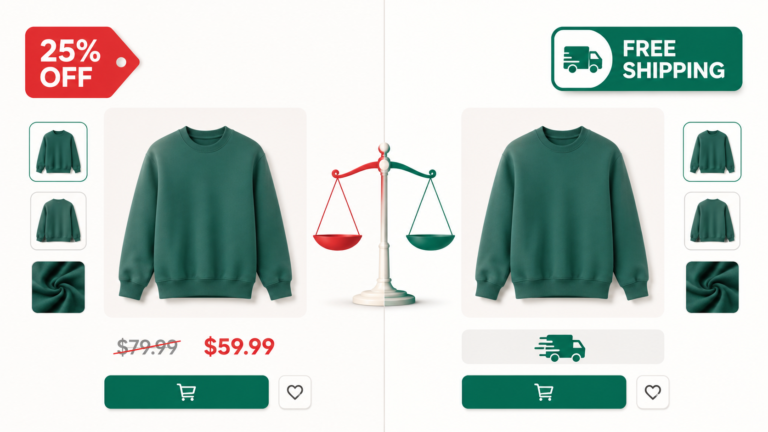
- Half your traffic, picked at random, gets the promotion (strike-through pricing, discount applied at checkout, the works).
- The other half lands on the store at full price.
- You measure revenue per visitor (RPV) for each group over the same window.
- The gap is your true lift.
If exposed RPV is $2.10 and control RPV is $1.80, your incremental lift is $0.30 per visitor. Multiply that by the number of visitors who saw the promotion and you have the real revenue the promotion generated, beyond what would have happened naturally. That is a meaningfully different number from “sale week revenue minus last week revenue”, and it is the only one your P&L should actually care about.
How to set up a holdout test in Adsgun
Adsgun has a Promotion vs Control test type built specifically for this. Inside the app, you flag the promotion you want to test for A/B testing in the promotion editor, then create a new test in the A/B Testing section and pick Promotion vs Control as the test type. One variant runs the promotion, the other shows your store at full price. Adsgun handles random assignment per visitor and keeps each visitor on the same variant for the duration of their session, so a shopper does not flip between full price and discount mid-browse.
A clean setup looks like this:
- Create the promotion you want to test (whatever offer you would normally launch).
- In the promotion editor, check Flag this promotion for A/B Testing. The status locks to Draft so it cannot run as a standalone promotion.
- In the A/B Testing section, create a new test, name it, and pick Promotion vs Control.
- Set the minimum duration. The default is 7 days, which is the recommended floor because Shopify shopping behavior cycles strongly by day of the week. Two full weekly cycles (14 days) is even better when you can afford the time.
- Use a 50/50 traffic split. This reaches significance fastest and is the right choice for almost every test. Skew the split only if you cannot afford to expose half your traffic to no discount during a peak window.
- Click Start.
Adsgun then tracks Visitors, Orders, Revenue, Conversion Rate, AOV, and RPV side by side. Orders and revenue update live. Visitor-level metrics come from GA4 and may lag 24 to 48 hours, which is normal. The full setup is covered in the Adsgun A/B Testing help center article.
What counts as a meaningful Shopify promotion lift
Not every gap between the exposed group and the control is real. You need statistical significance, which is the math that separates signal from noise.
Sample size to measure Shopify promotion lift
Sample size depends on three numbers: your baseline conversion rate, the minimum detectable effect (MDE) you want to catch, and your confidence level. A Shopify store sitting at a 2% baseline conversion rate that wants to detect a 15% relative lift at 95% confidence (80% power) needs roughly 35,000 visitors per variant. To detect a larger 25% lift, the requirement drops to about 13,000 per variant. The free Evan Miller sample size calculator is the industry standard for running this math.
The practical implication: if your store gets 500 visitors a day, a holdout sized to catch a 15% lift takes roughly two and a half months. If your traffic is lower, test bigger swings (30% off versus full price, not 10% off versus full price), accept longer durations, or both.
Significance and stopping rules
Adsgun enforces two guardrails before you can declare a winner: the minimum duration must elapse, and each variant must have received at least 100 visitors. Those are floors, not finish lines. For pricing decisions specifically, 95% statistical significance on RPV is the convention, and 99% if margin is tight.
The biggest mistake here is peeking. If you check the dashboard every day and stop the moment the numbers look good, you have inflated your false positive rate dramatically. As Evan Miller puts it in his canonical essay How Not to Run an A/B Test, peeking at a test ten times turns what looks like 1% significance into roughly 5% significance. Pre-commit to the sample size before launch and do not stop until you hit it.
Cannibalization: the silent cost of promotions
Even a holdout that shows clean incremental lift can hide a margin problem. Some of the revenue inside your exposed group came from customers who would have bought at full price anyway. They saw the discount, took it, and you lost margin you did not need to lose. That is cannibalization, sometimes called subsidisation.
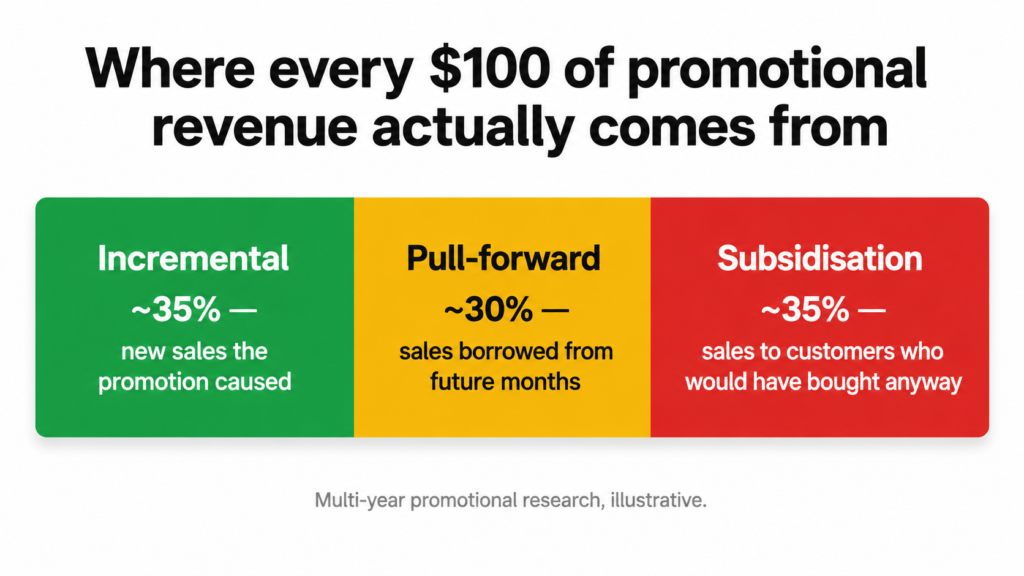
The numbers here are sobering. Multi-year promotional research suggests that 30 to 50 percent of promotional revenue in many product categories represents cannibalized future purchases or subsidised loyal customers rather than genuinely incremental demand. A 2024 benchmark study from Accuris on consumer goods promotions found that, on average, about 35% of every £100 of promotional revenue is subsidisation, meaning sales to loyal shoppers who were going to buy at full price. That figure comes from UK consumer-goods (FMCG) point-of-sale data and is described by Accuris as directional only, so treat it as a ballpark rather than a number that transfers cleanly to a DTC Shopify store’s own promotions.
A holdout test partially solves this because the control group reveals the baseline. If the control group still generated $1.80 RPV without any promotion, then for the visitors who would have bought regardless, the discount was pure margin loss. The exposed RPV minus the control RPV is your real revenue lift. Everything below the control line was sales you were going to make either way, just at a lower price.
A quick way to estimate cannibalization
Take your exposed group’s total revenue, then subtract (control RPV × exposed visitors). Whatever is left is incremental. The rest is, mathematically, revenue you would have collected at full price. If the gap is small relative to the discount you gave, the promotion is more expensive than the headline number makes it look.
Attribution windows and when to measure
Two more things will quietly skew a holdout test if you ignore them.
Attribution window. When does a sale count? If a visitor sees your promotion, leaves, and comes back four days later to buy, does that order belong to the test? For Shopify discount tests a 7-day attribution window from first session is reasonable. Anything shorter and you miss returning buyers. Anything longer and you start picking up purchases driven by something else entirely.
Pull-forward. Promotions move sales in time as well as creating new ones. If a customer was planning to buy in three weeks at full price and they buy now at 20% off, you booked the revenue early and at a discount. Sales the following month dip. If you only measure during the promotion window, you book the win and miss the hangover. The cleanest version of this measurement looks at revenue across the promotion window plus the four weeks that follow, comparing the exposed and control cohorts across the entire period. The promotion is genuinely profitable only if exposed cohort revenue still beats control cohort revenue after that tail.
A worked example with real numbers
The numbers below are invented but realistic. A store with about 1,200 daily visitors runs a Promotion vs Control test for 14 days. Total visitors: 16,800, split 50/50, so 8,400 per variant.
- Exposed group: 252 orders, $20,160 revenue, AOV $80, conversion rate 3.00%, RPV $2.40.
- Control group: 168 orders, $15,120 revenue, AOV $90, conversion rate 2.00%, RPV $1.80.
The control group’s higher AOV ($90 vs $80) is expected: discounts tend to pull in smaller, price-sensitive orders, which drags the exposed group’s average down.
Naive read: “The promotion generated $5,040 more revenue. Big win.”
Better read: RPV lift is $0.60. Across the 8,400 visitors who saw the promotion, that is $5,040 of true incremental revenue. So far so good.
But the discount was 20% off. The exposed group’s gross revenue at full price would have been roughly $25,200. The store gave up about $5,040 in headline discount to generate $5,040 in incremental revenue. The promotion broke even on revenue and definitively lost money on margin, because contribution margin per order dropped on every one of those 252 orders, not just the incremental ones. For a deeper breakdown of how this math hits the P&L, see our analysis of how Shopify discounts affect your profit margins.
This is the result you only see when you actually run a holdout. The naive week-over-week comparison would have called it a clean win and you would have run the same promotion again next month.
Run the holdout, ship the winner
Every promotion you launch without a holdout is a guess priced in margin. The math is not hard. The discipline is. To genuinely measure Shopify promotion lift you need a control group, a real sample size, an honest attribution window, and the patience to not call the test on day three.
Adsgun’s Promotion vs Control test type is built for exactly this measurement. For the wider playbook on offer-versus-offer experimentation (offer type, depth, urgency framing) pair this with our Shopify A/B testing discounts guide. For the analytics side, Shopify discount analytics covers how visible discount pricing changes your reporting, and how Shopify discounts affect conversion rate covers what to expect from typical promotion behavior.
Run one Promotion vs Control test before your next big sale. The number you get back will be more useful than any dashboard you have ever read.